research
Main menu
Morphogenetic field
Why a morfogenetic field theory? Motivation
In 1976
Lynn and Tucker studied the biological mechanisms responsible for
defining organelles position inside cells. This class of studies were
the observational and experimental support of the ‘morphogenetic
field’ notion. In the present paper [18] we studied
the morphogenetic field evolution yielding from an initial population
of cells to different unicellular organisms as well as specialized
eucariotic cells. Both types of cells were represented as Julia sets
and Pickover biomorphs, simulating Darwinian natural selection with a
simple genetic algorithm.
A morphogenetic field has been defined as a plane A with points
representing the locations where cells are differentiated or sub-
Our findings [18]
Modeling the zebra strip pattern
One of the
classical problems of morphogenesis is to explain how patterns of
different animals evolved resulting in a consolidated and stable
pattern generation after generation. In this paper [16]
we simulated the evolution of two hypothetical morphogens, or proteins,
that diffuse across a grid modeling the zebra skin pattern in an
embryonic state, composed of pigmented and nonpigmented cells. The
simulation experiments were carried out applying a genetic
algorithm (Transl.: Spanish) to the Young cellular automaton: a
discrete version of the reaction-
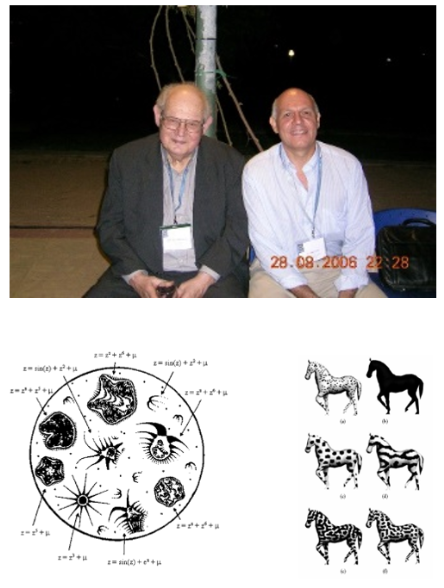
Evolving biomorphs with a simple genetic algorithm
Genetic
algorithms are stochastic optimization procedures based on Darwinian
natural selection. This optimization technique uses genetic operators,
thus procedures inspired in the genetic mechanism observed in
populations such as crossover or recombination (combination of two
solutions) and mutation (random change of a solution). At present, the
application of genetic algorithms to fractal is a common approach in
applied and theoretical research. In this paper [18]
a simple version of a genetic algorithm was applied to evolve a
population P(t), being P(t) a population of 'cells' or Pickover
biomorphs represented each one by a complex function. The genetic
algorithm was defined as follows:
1. Choose initial population P(0) of biomorphs.
2. Evaluate the fitness of each biomorph in the population P(t).
3. Select the best-
4. Breed a new generation through crossover and mutation and give birth to offspring.
5. Replace worst ranked part of population with offspring.
6. Until <terminating condition>
Top photo .-
Bottom .-
Biomorphs were evolved [18]
in different environments (or under different fitness functions,
see Fitness functions) to one of the following cellular classes:
• Class I. Ancient cells without cell nucleus and mitochondrion, a thin membrane and watery environment.
• Class II. Is a kind of cells similar to class I excepting the cells have mitochondrion.
• Class III. Cells have small size and a large membrane.
• Class IV. Small and round cells, with cell nucleus and mitochondrion, having a thin membrane.
• Class V. Cells similar to class III, excepting the cells have a larger size.
• Class VI. Large and round cells, with cell nucleus and organelles.
• Class VII. Large cells with radial symmetry, having cell nucleus and organelles.
• Class VIII. Aligned rectangular cells, with axial symmetry, developing layers or tissues.
• Class IX. Specialized in communication cell-
•
• Class XI. Cells specialized in the transport of substances, without cell nucleus (i.e. red blood cells).
The beauty of the mammalian vascular system
Beauty is a
characteristic of objects that provides a perceptual experience of
pleasure. In nature, aesthetic appreciation thereof has given rise to
the mathematical search for good series (e.g. the Fibonacci series) and
proportions (e.g. the Golden proportion) as important elements of
beauty. In 1928 the mathematician George David Birkhoff introduced a
formula for aesthetic measurement of an object. Birkhoff equation
defines the aesthetic value as the amount of order divided by the
complexity of the product. These two features can be measured easily in
poetry, music, painting, architecture, etc. In the fine arts, it is the
artist who manipulates both these features, but how does nature manage
order and complexity in living organisms or their parts? Here we show
[10c] how Birkhoff equation, applied to
the mammalian vascular system of eight representative animals, results
in new insights into the organization of the animal vascular system. In
a colaboration with Julio Gil (author of this very original idea) and cols. (Department of Anatomy, Embryology and Animal Genetics, University of Zaragoza, Spain) we found [10c] that
order and complexity are highly correlated in the mammalian vascular
system (R2=0.9511). Accordingly, in nature both features are not
independently managed in the manner of artists. We found significant
differences among the Birkhoff aesthetic values in the mammalian
arterial system, whereas no such differences exist in the venous
system. We anticipate our approach to be useful in the study of
morphogenesis and evolution of tree-